Launch of our new database

We are delighted to announce that we have  launched our new online, interactive  database .

Although the database is accessible online, it can also be downloaded in Excel spread sheet format.

The database allows its users to:

  • Search for individual writers and find out more about their demographic characteristics, such as age/year of birth, gender, occupational category, marital status.
  • Search for writers with specific demographic characteristics, such as gender, or year of birth.
  • Identify writers’ writing behaviours – showing the directives to which individual writers have responded.
  • Search for directives and themes.

We have written some FAQs intended to help new users.  There are also some simple tools (with instructions) to compare the Mass Observation writers with the broader UK population.

We hope that the database is easy to use. But if you identify any problems, please use the contact information at the top of the database website.

Over the next few weeks we are going to be publishing some ‘How to use the database’ videos/vlogs on the Mass Observation Archive’s YouTube channel.

We are also going to publish some videos/vlogs on some of the findings from the analyses that we have been working on. Please watch this space for updates.


Link

I was invited to present at the Research Methods Festival 2016 (RMF)  being held at the University of Bath, on the question ‘What is Mass Observation’ ?  This was a great opportunity to:

  • introduce Mass Observation to an audience that didn’t know much about this great source of qualitative data
  • provide some information on why we have been undertaking the Defining Mass Observation Project
  • provide some simple findings from the project, on ‘Who are the Mass Observation writers?’

Do take a look at the presentation in the link above, if you are interested.

Taking part in the RMF was a really positive experience. The audience were really friendly and interested in the presentation. Everyone attending seemed to get a real buzz out of thinking about methods, and how and why we use certain methods and data sources.  And I was able to attend some really interesting and exciting presentations.  My particular high point was a session on ‘Paradata’ which had some strong cross-overs with the Defining Mass Observation project.


EVENT: 18 July 2016 – Who are the Mass Observation Writers, 1981-2016

18thJulyCome to the launch of ‘The Defining Mass Observation Project’ and database. The event will include:

  • An introduction from Professor Pat Thane
  • The launch of the online database
  • Information on using online interactive tools for sampling writers & writing
  • Information on findings on writers’ socio-demographic characteristics
  • Discussion of writers’ class and identity
  • Discussions on memory and Mass Observation writing
  • Information on using computer assisted data analysis (CAQDAS) to analyse writing
  • Bring a laptop to use the database at the workshop!

The event cost £15 and includes lunch. Book here.

Transcription as a ‘moment of contact’ with qualitative data

The processes of undertaking stage 1 of the analysis of Mass Observation writers’ responses to the Life Lines directive leads me to reflect on something I often say to participants of my analysis courses – the various ‘moments of contact’ we have with our data during qualitative analysis.
Revisiting data at different times, from different perspectives and for different purposes is characteristic of the iterative nature of qualitative analysis, and must be prized as essential in the development of a valid interpretation. Transcription is a key ‘moment of contact’ that shouldn’t be undervalued.
We all know that transcription is time-consuming. The speed with which we can type, the technology used to facilitate the process and the form of transcript being generated all affect the amount of time it takes, but it’s typically suggested that an hour’s worth of audio recording – say from an open-ended interview – takes between 8 and 10 hours to transcribe. If you’re working with video, perhaps transcribing interactions between participants and the characteristics of the setting, as well as the content of what is being said etc. then it takes longer. Voice-recognition software is sometimes thought to offer a solution, but this is unlikely to be the case – see here for the reason why!
Several CAQDAS packages, such as ATLAS.ti, MAXQDA, NVivo, QDA Miner, HyperRESEARCH, Qualrus, and Transana (see CAQDAS Networking Project for reviews of these products) provide the ability to analyse audio, video and image data ‘directly’ – i.e. without the need for a written transcript that represents the original data. There are many analytic reasons why this might be useful.
But this technical ability also brings with it the danger of enabling lazy researchers to be lazier. Often  students get very excited when they realise that the CAQDAS package they have chosen enables direct analysis of audio-visual material. It’s almost like you can see them thinking “wow, I don’t have to do that boring transcription any more”.
(Note of clarification here, by the way – I’m NOT saying the technology encourages laziness. Technical affordances do not – and cannot – in and of themselves encourage us into certain practices, because we, as humans, as researchers, are always in control of deciding what purpose to put a technological feature).
My response to this is: Why would you think transcription is boring? Just because something takes time doesn’t mean it’s boring, surely?! You designed and undertook the interviews or focus-groups, observed the settings, designed the open-ended survey questions, whatever. Therefore how can you be bored by transcribing, formatting and preparing the data? It’s the basis of how you will go about the analysis, in fact, its an integral part of analysis.
I’m currently teaching my daughter to read. She’s four. It’s taking a while. It’s a process that involves a huge amount of repetition. I’ve spent approximately an hour a day for the past several months on this. Just like when I transcribe I’m faced with having to write out the same or similar passages several times – because research participants often say similar things in response to our interview questions – my daughter and I read the same books several times before moving on to a new one. We do that to consolidate her learning. True, after the third time she’s usually had enough of the story (you could perhaps say she’s ‘bored’ with it), but she’s also pretty chuffed with herself because she realises she can read it more easily and with more fluency the third time than she did the first. She’s ready to progress. My daughter has an older brother, he’s 8. I absolutely love the fact that he is now an accomplished reader and that he voluntarily spends time reading a range of fiction (currently he is reading Harry Potter), and non-fiction (historic, geographic and wildlife encyclopaedias are his favourite) and these days would rather read on his own than to or with me. But his reading skills are in large part a result of the time we spent together repeatedly practicing the core elements of reading that he now unconsciously exercises independently.
Why am I telling you anecdotes about my childrens’ reading learning experiences, you may be wondering? Because their experiences are a useful analogy for what we need to do as qualitative researchers with our materials. Just as my son and daughter have – and need – repeated ‘moments of contact’ with phonetic letter sounds, words, sentences, paragraphs, chapters and books to consolidate their reading expertise, so we, as qualitative researchers, have – and need – repeated ‘moments of contact’ with our data. We need those moments to achieve the deep level of contact and understanding that leads to an authoritative and valid interpretation. This is true whatever our research objectives, methodologies, analytic strategies.
The number and types of ‘moments of contact’ we have depend on the project’s characteristics – including research questions, type and amount of data, analytic approach, levels of analysis and types of output. And the way software tools are harnessed. For Defining Mass Observation, the analysts did not have the benefit of transcription as a ‘moment of contact’. For various practical reasons, others were employed to transcribe the hundreds of hand-written narratives. As they were doing so we realised that the process was providing them with not only an overview of the breadth of content contained within the materials but also valuable insights that could inform our analysis. We therefore took the opportunity of interviewing them towards the end of their process and have taken their thoughts into account in designing and undertaking the analysis. They had the overview of content that the three qualitative analysts didn’t have, which, as discussed in this blog post, was a key factor in shaping out analytic design.
During the analytic planning stage, we undertook a pilot analysis of a sub-sample of responses to both the “My Life Line” and “Social Divisions” Mass Observation Project (MOP) Directives. This involved several tasks which entailed repeated ‘moments of contact’ with the data, including the following:
– identifying, defining and representing concepts
– familiarising with the data by exploring content at a detailed level
– experimenting with different conceptualisation strategies (open-coding for thematic content, coding for tone of expressions, capturing the chronology of events, etc.)
– interrogating the occurrence of different types of codes in the data and in relation to writers with different characteristics
This pilot work essentially involved undertaking a whole mini-analysis of the sub-sample of data, experimenting with different ways of undertaking analysis and evaluating the extent to which these would enable us to answer our research questions. This resulted in designing an overall analytic plan, which we are now in the process of undertaking.
For the “My Life Line” Directive, we are just completing Stage 1: High-Level Semantic Content Mapping, which has involved the seven “Phases of Action” comprising various analytic tasks. I’ll discuss those in a different blog post. The point I want to make now is that the analysis plan was designed to overcome the lack of an overview, on the part of the the analysts, of content of the extensive material as a whole. We needed to design a process that enabled us to gain this overview quickly and comprehensively. Although we gained a lot from interviewing the transcribers, we couldn’t rely solely on their insights as they had not been asked to think about the data they were transcribing in relation to our research questions. In addition, because there are three qualitative researchers working on the analysis we needed to design a process that ensured consistency and equivalence without each of us having to engage to the same level with all the transcripts.
However, as I have been undertaking stage 1, I’ve been thinking about how we would have designed the analysis differently if we had participated in the transcription process. Would undertaking transcription have meant the analytic plan would have been different? Would we have had to go through the extensive pilot planning stage at all? At least it would have been different because it would have been more pointedly informed. We would have made notes as we were transcribing, and these would have informed the design. The lack of a comprehensive overview of content was a key factor underlying our design, so therefore it stands to reason that had we had that overview we would have undertaken the analysis somewhat differently. We would still have had to undertake the high-level semantic content mapping process because in order to answer our research questions we need to consistently map out the topics discussed and the ways in which they are discussed. But there are certain areas of data conceptualisation (commonly called ‘coding’) which would perhaps have been more focused more quickly had the analysts been involved in the transcription. So that the dilemmas we encountered about how to code for certain aspects would have been pre-empted.
All projects are different and researchers have to respond to their characteristics in order to enable systematic and high-quality analysis. It’s always a balance between practical and analytic needs. I’m not saying that our analysis would be better if we had done the transcribing ourselves, and within the parameters of the funding for this project, that wouldn’t have been possible anyway. But the way we approached the analysis would certainly have been different. We have had to build in certain steps to overcome the lack of overview of content that would either not have been required, or would have been different.
So, the point about transcription that the DMO project underlines is that transcription is an analytic act. This is not a new idea, but one that is often overlooked or suppressed. What you decide to transcribe and how you decide to format your transcriptions, affects how you can go about analysis. Therefore transcription shouldn’t be undervalued as a process. It’s probably true that as researchers progress through their careers they become less likely to be the ones undertaking transcription. It’s very common for transcription to be contracted out and there are many professional services for doing so. In funded projects like DMO contracting out transcription is a practical issue, as its often just too expensive for professional researchers to undertake transcription within tight budgets. This doesn’t have to be a problem – as our experience shows, analysis can be designed to overcome what is lost by not transcribing oneself.
However, don’t undervalue transcription. If you’re a student you have the luxury that you may never get again to engage with your data during this important process. Thinking of transcription as a ‘moment of contact’ with data, during which you can take notes about content and potential avenues for analysis, rather than a boring task you just want to finish, will free you to make the most of your data.
Christina Silver

The Many Faces of Class

In the previous blog (‘The Persistence of Class’), I outlined how we have found that the idea of class held a really important place in the identities and observations of Mass Observation writers when they responded to the 1990 Social Divisions directive.  However, this is only part of the story.  Of equal significance to our analysis has been our exploration of how class is discussed by the MO writers.

What we have discovered is that MO writers have complex, multi-faceted and ‘vernacular’ understandings of class that do not fit neatly within any systematic sociological models.  Thus, as with the contrasting way in which class continued to be really important to MO writers whilst the significance of class declined within academic scholarship, we see another discrepancy between the views of ordinary people and academic thinking.

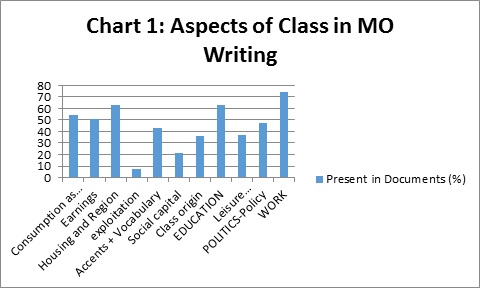
The models of class constructed in writers’ responses do not seem to reflect any particular sociological model of class, contemporary or otherwise.  Instead, the models of class are exceptionally complex and use an extremely wide range of indicators.  This is demonstrated in the breadth of class codes in our coding system, which includes Patterns of Consumption, Income, Housing and Region, Exploitation, Accents + Vocabulary, Social Networks, Class Background, Education, Politics, Leisure and Travel, and Work.  The importance of these factors varies from writer to writer but multiple factors feature in almost every script.  This is illustrated in Table 1, which demonstrates how commonly cultural, economic, social and political aspects of class occur across the documents.  Although factors such as ‘Work’ and ‘Education’ – key tenets of most sociological models of class – feature heavily, they are rivalled by more intangible factors such as ‘Accent + Vocabulary’, ‘Politics’ and ‘Housing and Region’.[1]

Untitled

This has a number of consequences for our analysis.  One that is immediately apparent is that these ‘vernacular’, or ‘everyday’, understandings of class mean that there are clear distinctions between where individuals place themselves within the British class structure and where social scientific models of class would place them.

Let’s take the example of A22: the Social Census classifications in 1990 – the closest classification model – positioned A22 in group 4 of 9 (1 as highest class, 9 as lowest), ‘Clerical and Secretarial Occupations’.   However, A22 defines herself as working class because ‘with my Lancashire accent I am never going to achieve “middle classness”.’  Similarly, B1106 identifies as working class despite being positioned in occupational group 3, ‘Associate Professional and Technical Occupations’, because he ‘always felt a great affinity with my maternal grandmother and her struggle through life.’  Rather than a straightforward relationship between occupation and class position, the MO writers use complex and varied models of class that make use of cultural, social, geographical, economic, political and background factors to define themselves and others.  Moreover, the MO writers are much more comfortable developing their own models of class to understand society and define their class identities than they are with adhering to existing sociological models.

However, we have noticed that writers do refer to sociological definitions of class, sometimes overtly and openly, sometimes implicitly.  This is reflected in the consistency with which they use certain sociological frames, such as work and education.

Therefore, in the next stage of our analysis we will explore themes and patterns in the ways in which class is constructed across the sample of writers.  We will examine whether social factors such as age, gender or self-defined class identity affect the way in which people think about and construct their own models of class.  This will enable us to explore how class is understood, defined and constructed from the ‘bottom-up’ and how these ‘popular’ systems relate to existing models in social science.  This will provide us with insights into how class was felt and lived in 1990.

[1] For examples of dominant sociological models of class see the Social Census (http://www.ons.gov.uk/ons/guide-method/classifications/current-standard-classifications/soc2010/soc2010-volume-3-ns-sec–rebased-on-soc2010–user-manual/index.html) or the Eriksen-Goldthorpe model in R. Erikson and J. H. Goldthorpe, The Constant Flux: A Study of Class Mobility in Industrial Societies (Oxford, 1992).

Qualitative Analytic Design #2: Phase One – High-level mapping of semantic content


Following on from discussion the factors informing the design of or analysis, I promised to outline each phase of our analytic plan. Here’s the first.

First, though, it’s useful to illustrate the analytic plan in its entirety, because in undertaking any phase of analysis it is always crucial to build on what has gone before, and anticipate what will happen as a result. That’s what makes analysis focused.

The diagram below shows the four phases of analytic plan as it currently stands. You’ll notice that in my last blog post I said our plan had three phases. Since then we’ve got further into the analysis and now are thinking about the phases slightly differently. That’s the nature of qualitative research design, it develops as the project proceeds.

Screen Shot 2016-01-21 at 09.46.27

It’s important to note that this diagram relates specifically to the qualitative analysis of the MOP writers’ narratives, but this is only one part of the Defining Mass Observation project. How the quantitative analysis of writers’ characteristics integrates with the work I’m discussing here will be the topic of a separate blog post later on.

The first phase takes the form of mapping out the content of the materials at a high level. This is necessary because we didn’t have an overview of the materials at the outset. See here for a discussion of why this is. 

There are three elements to this mapping process, that are undertaken in parallel.
– indexing the narratives according to semantic content (via descriptive coding)
– capturing the emotional tone of the writings (coding for expressions)
– reflecting on and summarising each writers’ narrative in relation to the Research Questions


Indexing semantic content
Our pilot analysis identified key areas that we need to know about if we are to be able to answer our research questions. For the starting research questions for My Life Line and Social Divisions see here.  

There are several things we need to do in order to be able to answer these questions. First, we need to know which events writers discuss in their responses and how they express themselves when writing about them. For example, with respect to the My Life Lines Directive, we cannot analyse how and why certain events are significant, meaningful or how they structure writers’ lives unless we first know what events are reported and how they are discussed.

These factors underlie the need for a multi-staged approach and our focus on mapping out semantic content at a high-level first.

Some areas that we need to index are specific to the Social Divisions and My Life Lines Directives, although as shown below, there are many overlaps. The overlaps are one of the ways that we well be a able to integrate analysis of the two directives later on.

Screen Shot 2016-01-21 at 09.37.08


So what do we mean by ‘semantic content’ and how do we go about ‘high-level mapping’ in MAXQDA?

To quote Braun & Clarke (2006:13): “With a semantic approaach, the themes are identified within the explicit or surface meanings of the data and the analyst is not looking for anything beyond what a participant has said or what has been written.” What this means for us, is that we are capturing – through coding – the content of the material in our key areas (the concepts in diagram above) from the ‘surface level’ of what is written. This means that the codes we’re using during this stage are not ‘themes’. They are areas of interest that we need to index in order to be able to answer our research questions – during this stage their purpose is essentially descriptive – to map out the content of the data according to the ‘surface’ or ‘semantic’ level.

Capturing the emotional tone of the writings
In addition to mapping out the semantic content of writers’ responses to the Directives, we also need to capture the way in which they write, the ways the present their accounts. The research team had extensive discussions about the best way to go about doing this, discussions that were driven by the overarching objectives of the study, but also informed by what we know is possible using our CAQDAS package of choice for this project, MAXQDA. See here for a discussion of the factors informing our choice of software. Any qualitative text can be read at different levels, for example, what is explicit in the text, what is implied and what can be inferred through interpretation.

Given that this phase is generally about mapping out the semantic content of the material, our aim in capturing the emotional tone of the writings is to interrogate whether certain topics and events are written about in a generally positive, negative or neutral way. Coding for expressions beyond what is explicitly present in the writing – for example because we know from earlier statements the writers’ feelings about certain topics – would mean that we lose that they have recorded an event or experience in a particular way. For example, in the My Life Line material, coding the straightforward statement “my cat died” as ‘negative’ because we know from earlier comments that the writer loved her cat, took her cat everywhere with her, perhaps partly as a result of having few close family members or friends, would lose that she records the event of her cat dying in a neutral, matter-of-fact way. The decision was therefore made to index every statement to one of the following codes: positive, negative, neutral, mixed. Doing so sets up the possibility to interrogate in the next phase of our analysis, whether certain events, experiences and topics are generally discussed in different ways.

Reflecting on and summarising each writers’ narrative in relation to the Research Questions
So, in indexing the semantic content and emotional tone of the writings, at this stage we’re not focusing on capturing our interpretations as analysts within the coding. No doubt this needs to be done, within the interpretive paradigm within which thematic analysis resides. And we’ll do this later on – but only once we’ve identified and prioritised core areas, which of course we cannot do until we have mapped them out.

However, whilst we go about this mapping process we do, of course, have thoughts and insights, make connections and interpretations. And we don’t want to lose them. Amongst the things that are core to what we all do in qualitative data analysis – whatever our objectives, methodologies, analytic strategies or tactics – is to reflect. We reflect on everything, all the time, we can’t help it. And nor should we. A key benefit of using a CAQDAS package, whichever one you choose, is that the thoughts you have can be captured within the software project, at the time you have them and, crucially, be linked to the data that prompted them.

We therefore developed a template for capturing these reflections during the process of indexing the semantic content and capturing the explicit emotional tone of the writings. This included the following elements: Opening, Topics, Language use, Classifications, Writing styles. As each writers response to the My Life Line and Social Divisions directives were indexed, these templates were filled in by the analyst. Each analyst had the freedom to make notes about these different elements in the ways that seemed appropriate for the individual response, but we each did so in relation to the overarching starting research questions for each directive, and the consistent template ensured the focus of our reflections was consistent. In particular, it meant that we were capturing the thoughts and insights we had about each MOP writer as we were reading and indexing their responses.

Screen Shot 2016-01-21 at 09.42.12

One of the issues with taking a high level semantic indexing approach is that it can be quite difficult to only think at this level when reading directive responses. For the reasons discussed above and in the blog post about the factors informing the design of our analytic approach, it was important to work initially at this level. However, we didn’t want to lose the more in-depth interpretive thoughts we had about writers whilst undertaking the indexing of semantic content and explicit emotional tone. The use of our structured template for reflections ensured that we could keep the coding at the right level, whilst capturing our interpretive thoughts. Both will be of use for the later stages of our analysis.

My next blog post will discuss the second phase of our analysis, analytic prioritisation.

Christina Silver


The Persistence of Class

The idea of “class” has been revived in recent years. The massive popular response to projects like the Great British Class Survey, as well as the critical and popular success of works such as Owen Jones’ Chavs and Selina Todd’s The People: The Rise and Fall of the Working Class, 1910-2010, have demonstrated a public appetite for “class” as a worthwhile topic for discussion. This has also been true for academic research with class analysis returning to prominence, no more so than in the wider project which incorporated the Great British Class Survey and sought to build a new model of class in the 21st century. These developments are reflected in the Defining Mass Observation research team’s decision to explore and analyse the ways in which MO writers understood and used class in their responses to the 1990 Social Divisions directive, which asked a series of questions about and related to class. (See https://definingmassobservation.wordpress.com/2015/10/12/mass-observation-in-the-new-times/ for an image of the directive).

In order to do this we have followed the inductive thematic analysis model outlined by Christina Silver in an on-going series of blog posts (see part 1 below). For the Social Divisions directive, and in relation to “class” in particular, we have analysed 95 scripts to develop a coding system which takes account of how class is discussed by the writers themselves. This takes the place of imposing an existing class model, such as the Bourdieuean model employed by Mike Savage et al. in the Great British Class Survey.

What became clear immediately through this approach is that all of the MO writers in our sample discussed class in one form or another in their responses to the directive. Whilst this seems extremely significant at first glance, it important to remember that the directive asked about class directly and therefore to not write about it would have required a conscious rejection of this aspect of the directive. Indeed, when compared to other explicitly mentioned topics for discussion (Table 1), such as race or gender, it is apparent that the MO writers were likely to discuss all the topics mentioned in the directive with class only slightly more prevalent at the level of individual scripts.

The Importance of Class

Table 1


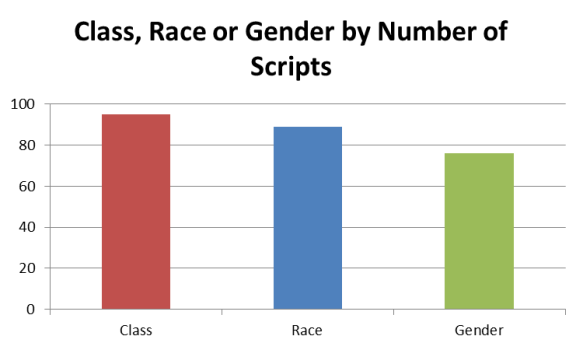
However, a different picture emerged when we compared the number of occasions when class, race or gender is mentioned by the writers. As Table 2 illustrates, the MO writers discuss class almost twice as frequently as race and nearly eight times as frequently as gender. Coupled with the fact that class is discussed by every writer on at least one occasion, this tells us that “class” is a concept that the MO writers felt more comfortable defining and musing on than any of the other ‘divisions’ suggested by the directive.

The Importance of Class (3)

Table 2

The dominance of class within the scripts suggests that despite the responses having been written during the ‘New Times’ of industrial decline, rising cultural and ethnic diversity, and significant changes in gender and sexual identities, it was class that was the most prominent and familiar topic of discussion for the MO writers. Thus, news of the ‘death of class’ emanating from academic circles at this time did not seem to have greatly influenced the attitudes of the Mass Observers.[1] Instead, class persisted as an understandable reference point for writers young and old, in every socio-economic group in our sample, and irrespective of gender. It may have been written about differently by different individuals and groups within the sample but its presence was inescapable.


[1] The ‘postmodern turn’ in the social sciences and humanities in the late 1980s and early to mid-1990s saw the concept of class come under attack from theorists who argued that it was ceasing to serve any useful analytical function. See for example Jan Pakulski and Malcolm Waters, The Death of Class (London, 1995) or Patrick Joyce, Class (Oxford, 1995). For an overview of the debates see Dennis Dworkin, Class Struggles (Harlow, 2007).

Qualitative Analytic Design #1: Factors underlying our approach

In her recent post, Rose commented on the variety in the responses to the 2008 Your Life Line Directive. This variety has shaped the way we are approaching the qualitative analysis of this and the 1990 Social Divisions Directives. So I thought I’d outline our analytic design and share how we are implementing it within MAXQDA (see here for an explanation of our choice of CAQDAS package). I’m doing that in a series of 4 posts, this is the first, check back over the next few weeks and months as our analysis proceeds for the next 3 posts, which detail the way we are going about each analytic phase.

Framed by the projects’ overall objectives, research questions and methodology, our analytic design evolved out of a pilot analysis phase when different approaches were trialled on a sub-sample of narratives from both Directives.

The resulting design involves three phases: i) high-level mapping of semantic content, ii) thematic prioritisation, and iii) in-depth latent thematic analysis. Each phase will be the subject of separate blog posts.

Here, though, I’m briefly discussing four factors that underlie this approach:

1) the nature of the data

2) the need to both keep separate and to integrate the analysis of the two Directives

3) the practicalities of the project

4) the need to develop a transparent and transferable process


The nature of writing for the Mass Observation Project (MOP) and the data that is generated

Because the writings of Mass Observation volunteers are only loosely guided by the questions in the Directive, we did not have an overview of the general content of the material at the start. This is symptomatic of this type of secondary qualitative data analysis. The narratives were not generated for the purpose of this study and therefore we have had no influence on the nature or content of the material we are analysing.

This is very different to the type of situation where researchers design and undertake interviews or focus-groups, or observe naturally occurring settings or events. Had we been involved in designing the Directive questions for a specific substantive purpose we might have had some ‘control’ but even then, the very nature of the MOP results in very varied responses to Directives. Some are short, others much longer; some specifically seek to answer Directive questions, others attend only very loosely to the Directive questions; some are written in a quite structured form, for example using bullet points, others are longer more free-flowing, discursive-style narratives; some are written in the first person and reveal detailed insights into personal experiences and opinions, others are more cursory, brief descriptions that upon first reading appear to reveal little about the feelings and opinions of the writers.

This varied nature means we have a very rich set of materials – just what qualitative data analysts love – but when we started out we had no idea of the content of this large body of varied writings. We therefore needed to design an approach that first provides us with an overview, so that we can evaluate the extent to which our research questions are answerable by the data. We could have achieved this by first reading all the Directive responses, but with almost 600 Social Divisions and almost 200 My Life Lines responses, some of which are many pages long, and a short-time frame, we couldn’t do this. We needed to be coding whilst reading. Had the analytic team done the transcribing, we would have had the broad content view we’re looking for from that process, but again, the project resources didn’t allow for that and temporary typists were employed to transcribe the responses. We did informally ‘interview’ the transcribers about their impressions of the MOP writers when they had finished, though, and this informed our thinking. But we could not solely rely on their opinions.

Analysing different sets of responses separately then integrating our analyses

Initially our intention had been to analyse responses to both Directives together, because one of our objectives is to explore the extent to which perceptions and lives have changed between 1990 and 2008 amongst writers who responded to both Directives (that we call ‘serial responders’). However, the pilot demonstrated that despite the need to analyse the ‘serial responders and despite the synergies across the two Directives’, starting out with all the data together would be impractical and would affect our ability to maintain focus whilst coding each Directive.

In addition, it became clear in our pilot coding that we cannot know at the outset which areas of our substantive interest offer potentials for looking across the two Directives. There are many potential synergies, and the longitudinal element of exploring the identities of writers that have responded to both Directives is an important part of our work. However, the Directives are very different and the context of the time in which these were responded to is important.

The practicalities of the project – number of coders and time-frame

Any project needs to attend to ensuring coding is consistent. The involvement of three coders and the short time-scales mean that we needed to design an approach that maximizes consistency from the outset. We could have mapped out the content of the Directive responses by undergoing an “open” coding exercise as a means of initial theme generation; this would have been similar to the usual first stage of Grounded Theory-informed projects. Indeed we did this in our pilot work and this informed the focus of phase one. However, the time available and the uncertainty of content means it is more systematic to focus first on the descriptive content and undertake more interpretive work once we have a clear idea of content.

The need to develop a transparent and transferable process 

One of the objectives of this project is to open up possibilities for using MOP as a source of secondary longitudinal qualitative data. This means that verified and assured processes for analysing MOP data that can be adopted or adapted by other researchers are amongst the projects outputs. The three-phased approach not only serves our analytic purposes but also offers a method that can be easily documented and illustrated.


Like qualitative research design in general, ours is iterative and emergent – we expect to need to refine our initial research questions as we progress – in light of our growing understandings. I will outline the three phases of the design (high-level mapping of semantic content, thematic prioritisation, and in-depth latent thematic analysis) and how they are being implemented in the CAQDAS package MAXQDA, in future posts.


Prescient Observers

It is very difficult to predict the future in politics. In recent months the Conservative Party won a parliamentary majority in the General Election whilst almost every polling organisation predicted a hung parliament. Meanwhile, the Scottish National Party lost an independence referendum but nevertheless gained enormous electoral support. Latterly, and perhaps most surprisingly of all – certainly for political pundits and bookmakers alike – veteran Labour MP Jeremy Corbyn was elected leader of the Labour Party despite beginning the contest as a 100-1 also-ran. Political expertise, it seems, is overrated.

So are the ‘ordinary’ Mass Observation (MO) writers any better at this? Much like contemporary commentators in both print and social media, MO writers are not shy of making political predictions about the future of their society. This was especially true of the Social Divisions directive in 1990. This directive, as the October 12 blog referred to, touched on broad issues of social, economic and demographic change, issues which encouraged some MO writers to respond in a ‘state of the nation’ manner which considered political ideologies and human nature. Take, for example, H1806’s thoughts on Communist societies:

‘It is virtually impossible to create a society of equal opportunity… A uniform society would produce a most boring way of living similar to Mao’s China or Stalin’s Russia. The human race needs variety and stimulation from different sources. We need competition in our lives which inevitably create rich and poor. As long as we do not go to the extremes this state would prove more colourful and exciting for as I have previously stated life would be dull if all our speech, colour, finances were roughly equal.’

The inevitability of competition and inequality in human societies due to our nature remains a commonplace view. For example, in a recent article for the Guardian, the campaigner and author George Monbiot, quotes a soon to be published report by the Common Cause Foundation which found that 78% of people believe others to be more selfish than they really are.

However, amongst the general political trends foreshadowed in the MO archive there are occasional moments of prescience in which our present appears to be repeating the past with uncanny similarities. The Conservative Government’s support for academies over local authority schools and the recent decision to approve a new grammar school has received an enormous amount of media coverage and analysis from proponents and critics. The latter though needed only to consult R470 who outlined the same critiques twenty-five years earlier:

‘There is an inbred desire to get back to the Grammar School , the nursery of the middle class. The opted out school is the future school of the ‘haves’.   The remaining Council schools will be just as the Council schools of my childhood, the place to dump kids to comply with the descendants of the 1877 Education Act. With minimum staff, facilities and equipment to educate the future working class to read and write (not too well).’

R470’s perspective may be more emotive than the mainstream press but its ideological foundation is much the same. This shows that you don’t need to be a highly educated Guardian journalist to critique public policy. Sometimes, like R470, you just have to live it. MO writers like R470 often used their personal accounts to reflect on the politics of their own period as well as the problems they surmised correctly would persist in our contemporary society. Thus, they do not see their role as just ‘observers’ of their everyday lives but of their whole society.

First looks at the Defining Mass Observation Project database

In recent weeks, Ian Waldock and Jason Sadler (both based at Geodata at the University of Southampton) from the project team have started work on the Defining Mass Observation Project database and we now have a website to test.

The database brings together biographical data submitted by the Mass Observation writers upon joining the MO Project with their individual writing record. Using this database, researchers will be able to sample writers based on biographical characteristics and discover more about the writing behaviours of the Mass Observation Project Panel members.

The data in this database has been collected by the Mass Observation Archive and processed by a team of volunteers, who have generously given their time to the Defining Mass Observation project. It was gathered from the biographical forms completed by the Mass Observers when they join the Project and from the catalogue records produced by Mass Observation staff as part of the process to archive new material which has been submitted to Mass Observation.

The information in this database has always been available to researchers, but not in such an accessible form. In the past, to find out more about the biographical profile of the writers, researchers were required to visit the Archive to trawl through thousands of non-electronic records; a very time consuming task! Researchers wanting to know about the response rate to each Directive, were encouraged to use The Keep catalogue. This catalogue contains over a million records relating to the thousands of diverse collections that The Keep cares for, so it is easy for a researcher to get lost amongst all of records!

We hope that this database will enable researchers, for the first time, to discover more about the Mass Observation Project and its writers quickly and remotely. We are excited about the opportunities and projects this will open the Mass Observation Project up to.

We are interested in feedback about the website and database and in getting some users to test the new site. We will update the blog once we have moved on to this stage of the project.